Ready to dive into your business data? Your Helcim account comes equipped with powerful reporting tools that can give you valuable insights into your sales, inventory, and more.
This article will guide you through the default reports page, Business Overview. It gives you a real-time look at your sales performance, payment methods, and top-selling products in one place.
What features does it have?
The Business Overview page transforms your daily transaction numbers into clear, organized insights:
High-level summary metrics
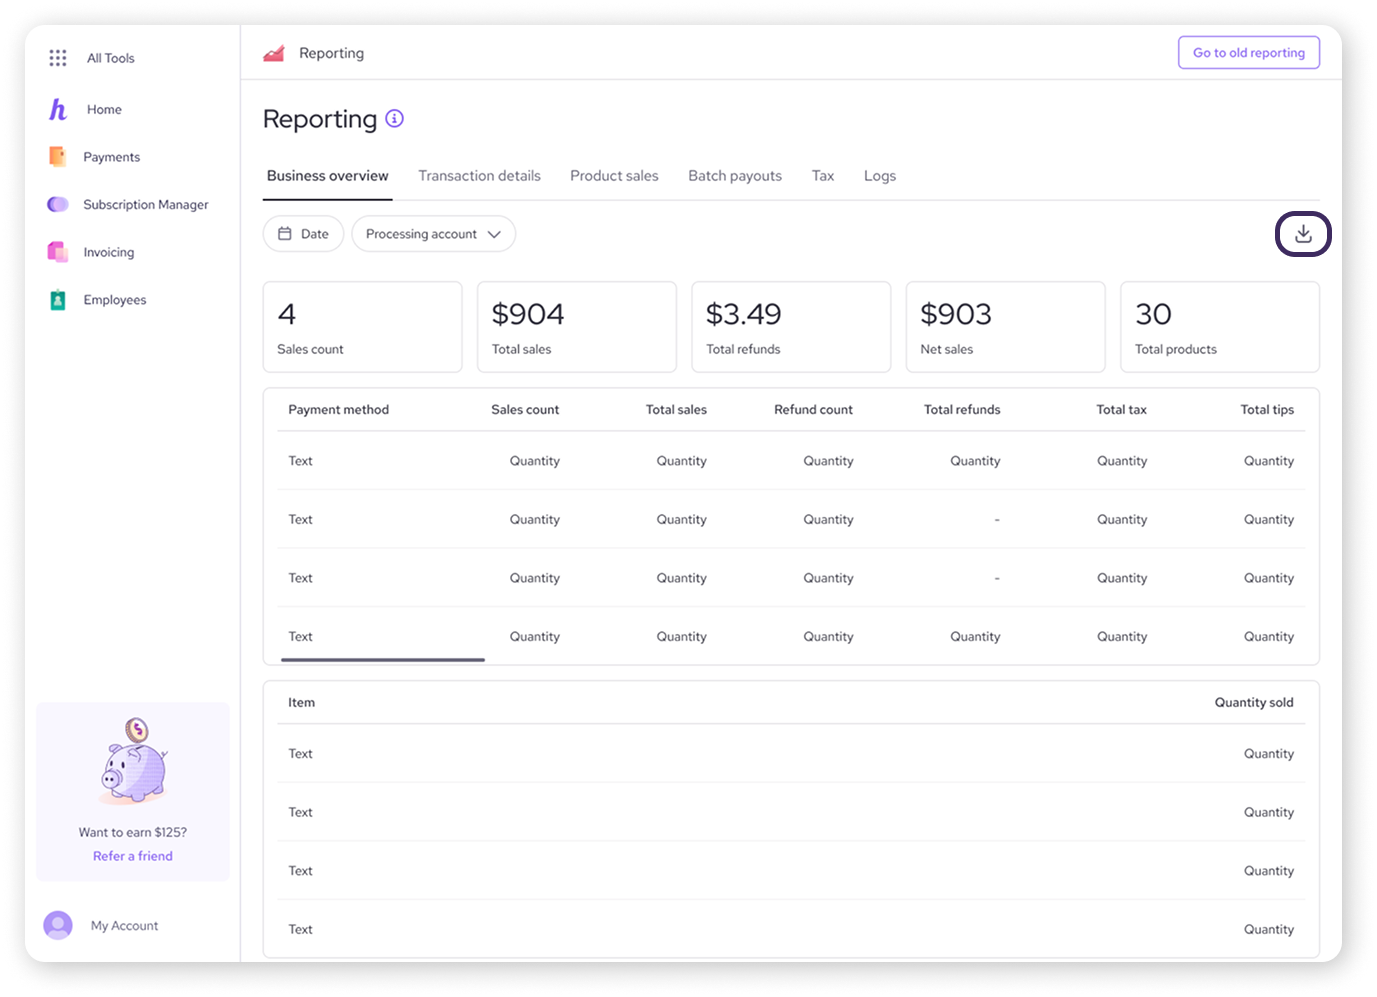
Right at the top of the page, you will see your total snapshot numbers for your selected date range:
Sales Count: The total number of successful sales completed.
Total Sales: The gross dollar volume of all sales transactions processed.
Total Refunds: The total value of returns processed back to customers.
Net Sales: Your true bottom-line sales figure after subtracting refunds.
Total Products: The total number of products sold.
.png)
Scrolling down, you will find two tables that add more context to your totals:
Payment method breakdown
A line-by-line breakdown showing how customers Payment Method (e.g., Credit Card vs. Debit) along with specific Sales count, Total sales, Refund count, Total refunds, Total tax, and Total tips for each method.
Product Sales
Keep tabs on your inventory performance. This section displays your top product sales, neatly split between the specific Items sold and the exact Quantity of each item that went out the door.
Filtering and exporting your data
Reporting is only useful if it shows you the right information. Use these tools to narrow your focus or take your data to go.
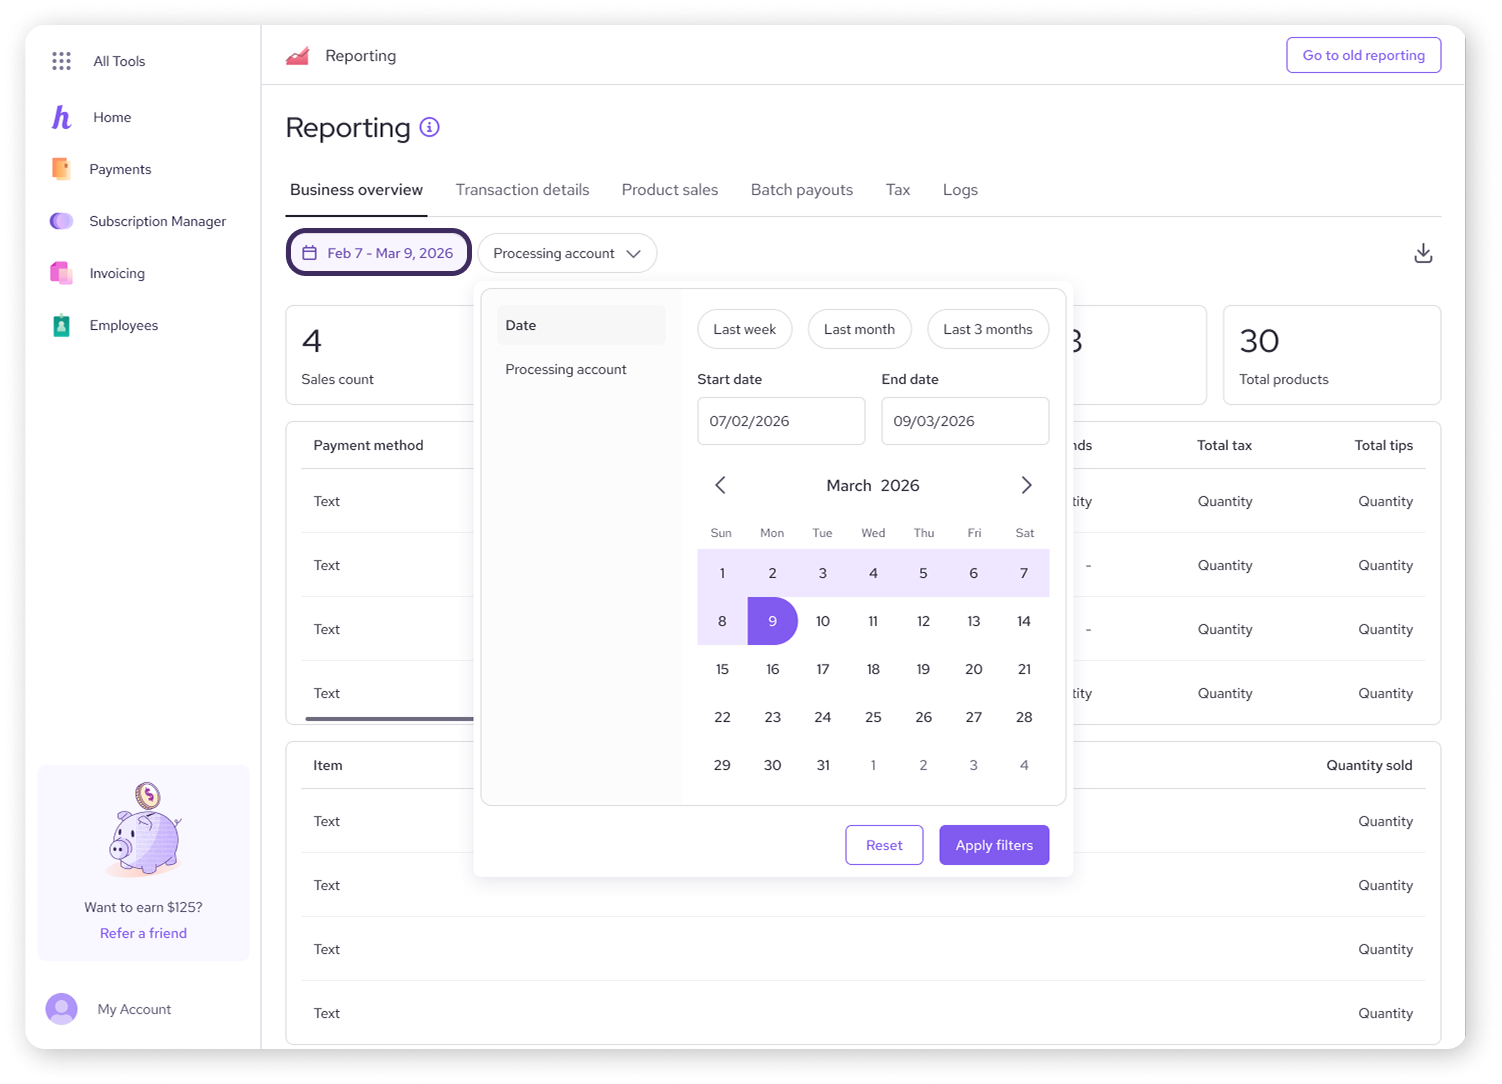
Using filters
Date: Click the Date button in the top left to open a calendar. You can select specific start and end dates to see how your business performed during a particular week, month, or holiday rush.
Processing account: If you run multiple locations or have several merchant accounts under one Helcim login, use the Processing account dropdown to switch between them.
Exporting your report
If you need to send these numbers to your accountant or perform some advanced spreadsheet magic, look for the Download icon (the arrow pointing down) in the top right corner.
| Clicking this will generate a CSV file containing all the data currently shown on your page. |
FAQs
How often does the data on the Business Overview page update?
Your sales figures, counts, and product volumes update in real time. As soon as a transaction clears your terminal or online store, it hits your dashboard.
Why do my Net Sales look lower than my Total Sales?
Your Total Sales reflect gross revenue before any returns. Net Sales automatically subtracts your Total Refunds to give you an accurate picture of the revenue you are actually keeping.
Where can I find my historical bank transfers on this page?
While the Business Overview shows your general sales volume, bank deposits are tracked separately. Click on the Batch Pay outs tab at the top of the page to see exactly when funds were bundled and sent to your bank account.