Understanding what's selling well and managing your inventory effectively are key to business success. Helcim's product and inventory reports give you the insights you need to optimize your offerings, make smart purchasing decisions, and boost your profitability.
| To learn how to access these reports and others, read this article first: Accessing and Generating Reports. |
This article will guide you through the 'Goods Sold' report, 'Product Inventory' report, 'Top Selling' reports, and 'Top Grossing' reports to help you keep your finger on the pulse of your product performance.
In this article
Goods sold report: tracking individual product sales
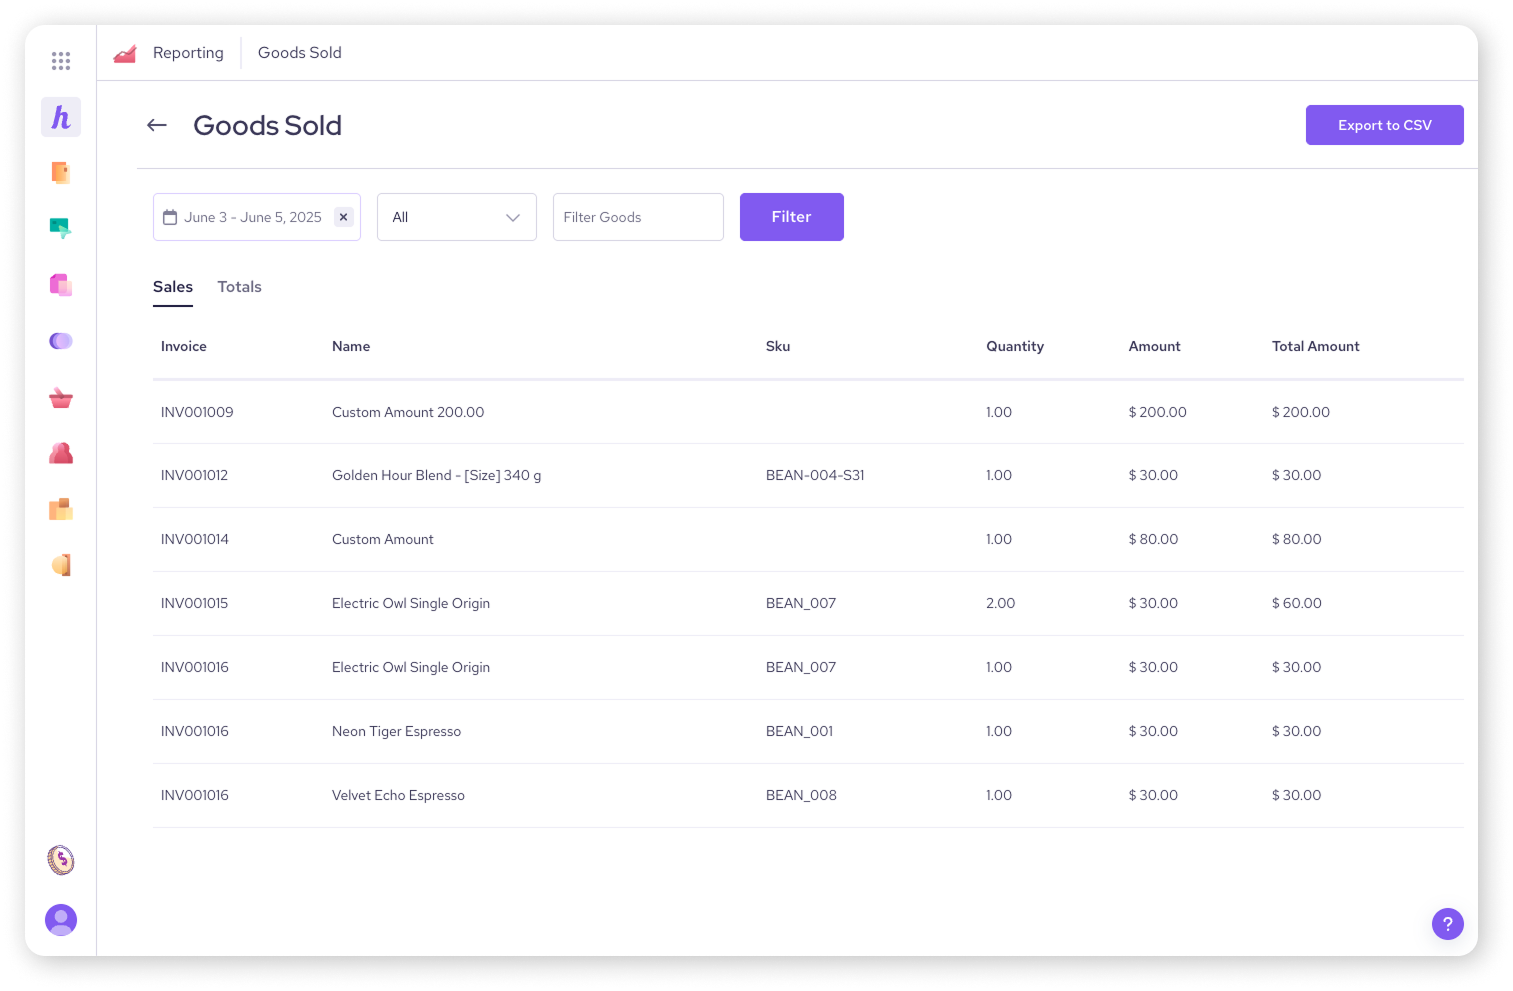
The 'Goods Sold' report provides a detailed breakdown of products and services sold over a chosen period.
Report columns include:
Invoice number: The unique identifier for the invoice associated with the sale.
Name: The name of the product or service sold.
SKU: The stock keeping unit, a unique identifier for the product.
Quantity: The number of units of the product sold.
Amount: The individual price of the product.
Total amount: The total price for that specific line item (Quantity x Amount).
| You can use the Filter Goods box to enter a keyword to filter by. For example, entering "Electric" and clicking Filter would bring up any goods with "Electric" in their name. |
Product inventory report: managing your stock
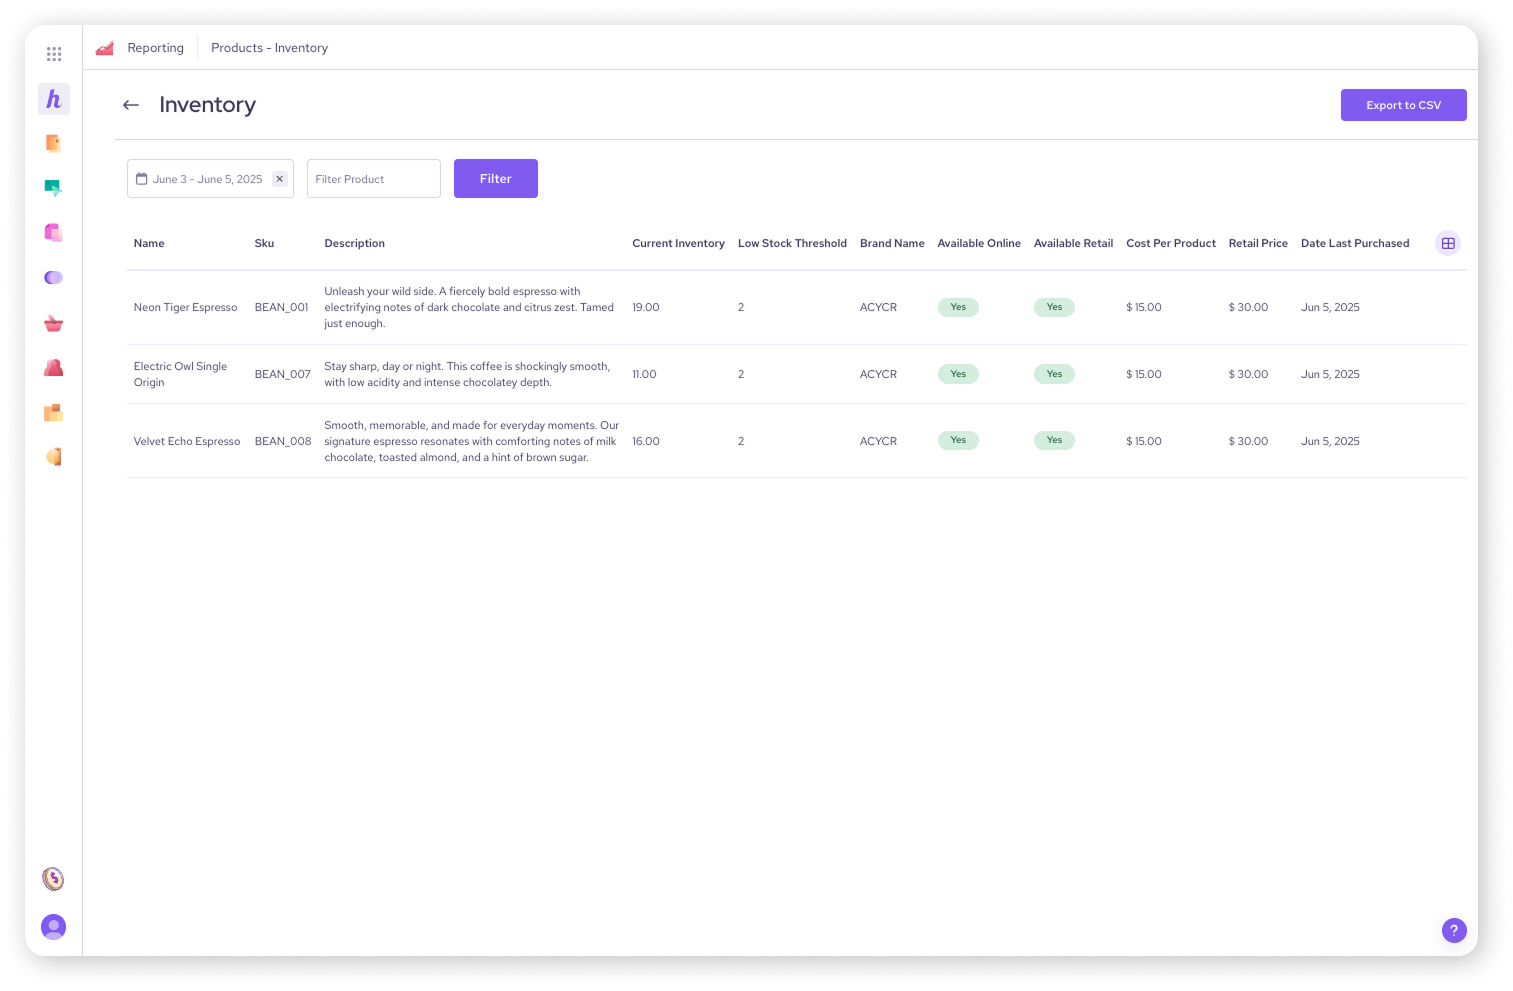
The 'Product Inventory' report helps you keep track of your current stock levels and make informed reordering decisions.
| Only products that were sold within the filtered dates will display in this list. |
Report columns include:
Name: The name of the product.
SKU: The stock keeping unit, a unique identifier for the product.
Description: A brief description of the product.
Current inventory: The current quantity of the product available in stock.
Low stock threshold: The set minimum inventory level at which a product is considered low in stock.
Brand name: The brand associated with the product.
Available online: Indicates if the product is available for sale through your online store.
Available retail: Indicates if the product is available for sale in your physical retail location.
Cost per product: The cost of acquiring each unit of the product.
Retail price: The price at which the product is sold to customers.
Date last purchased: The last date on which this product was restocked or acquired.
You can use the Filter Product box to search for specific products by keyword.
Top selling reports: identifying your most popular items
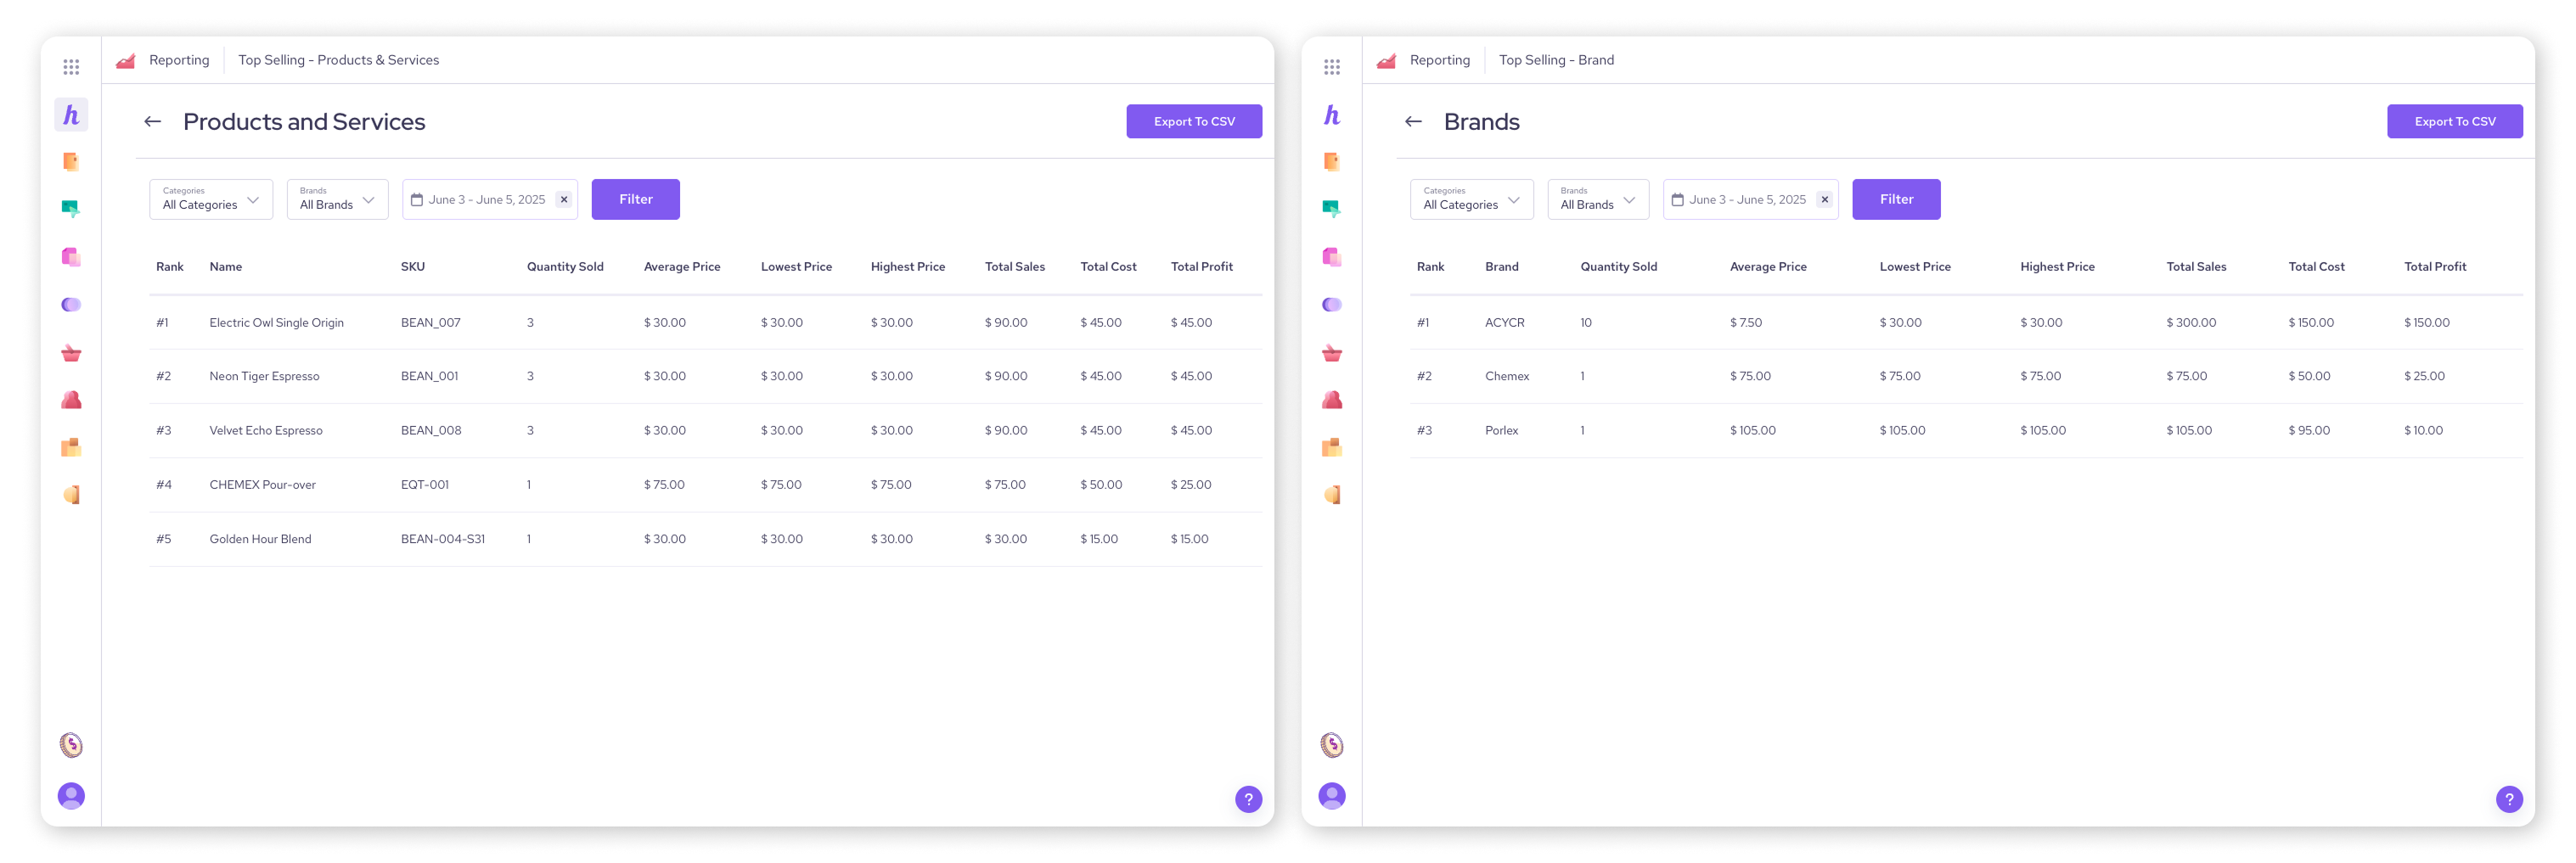
Want to know what your customers love? The 'Top Selling' reports rank your products, brands, and categories by the quantity sold. This is invaluable for marketing and understanding customer demand.
Available reports:
'Top Selling - Products & Services': Ranks individual items by quantity sold.
'Top Selling - Brand': Ranks overall brand performance by quantity sold.
'Top Selling - Category': Ranks product categories by quantity sold.
Common columns across these reports include:
Rank: The product's position in the sales ranking.
Name (or Brand Name/Category): The name of the product, brand, or category.
SKU (for products & services): The stock keeping unit for the product.
Quantity sold: The total number of units sold.
Average price: The average price at which the item was sold.
Lowest price: The lowest price at which the item was sold during the period.
Highest price: The highest price at which the item was sold during the period.
Total sales: The total revenue generated from the item.
Total cost: The total cost of the items sold.
Total profit: The total profit earned from the item (Total Sales - Total Cost).
Top grossing reports: finding your most profitable items
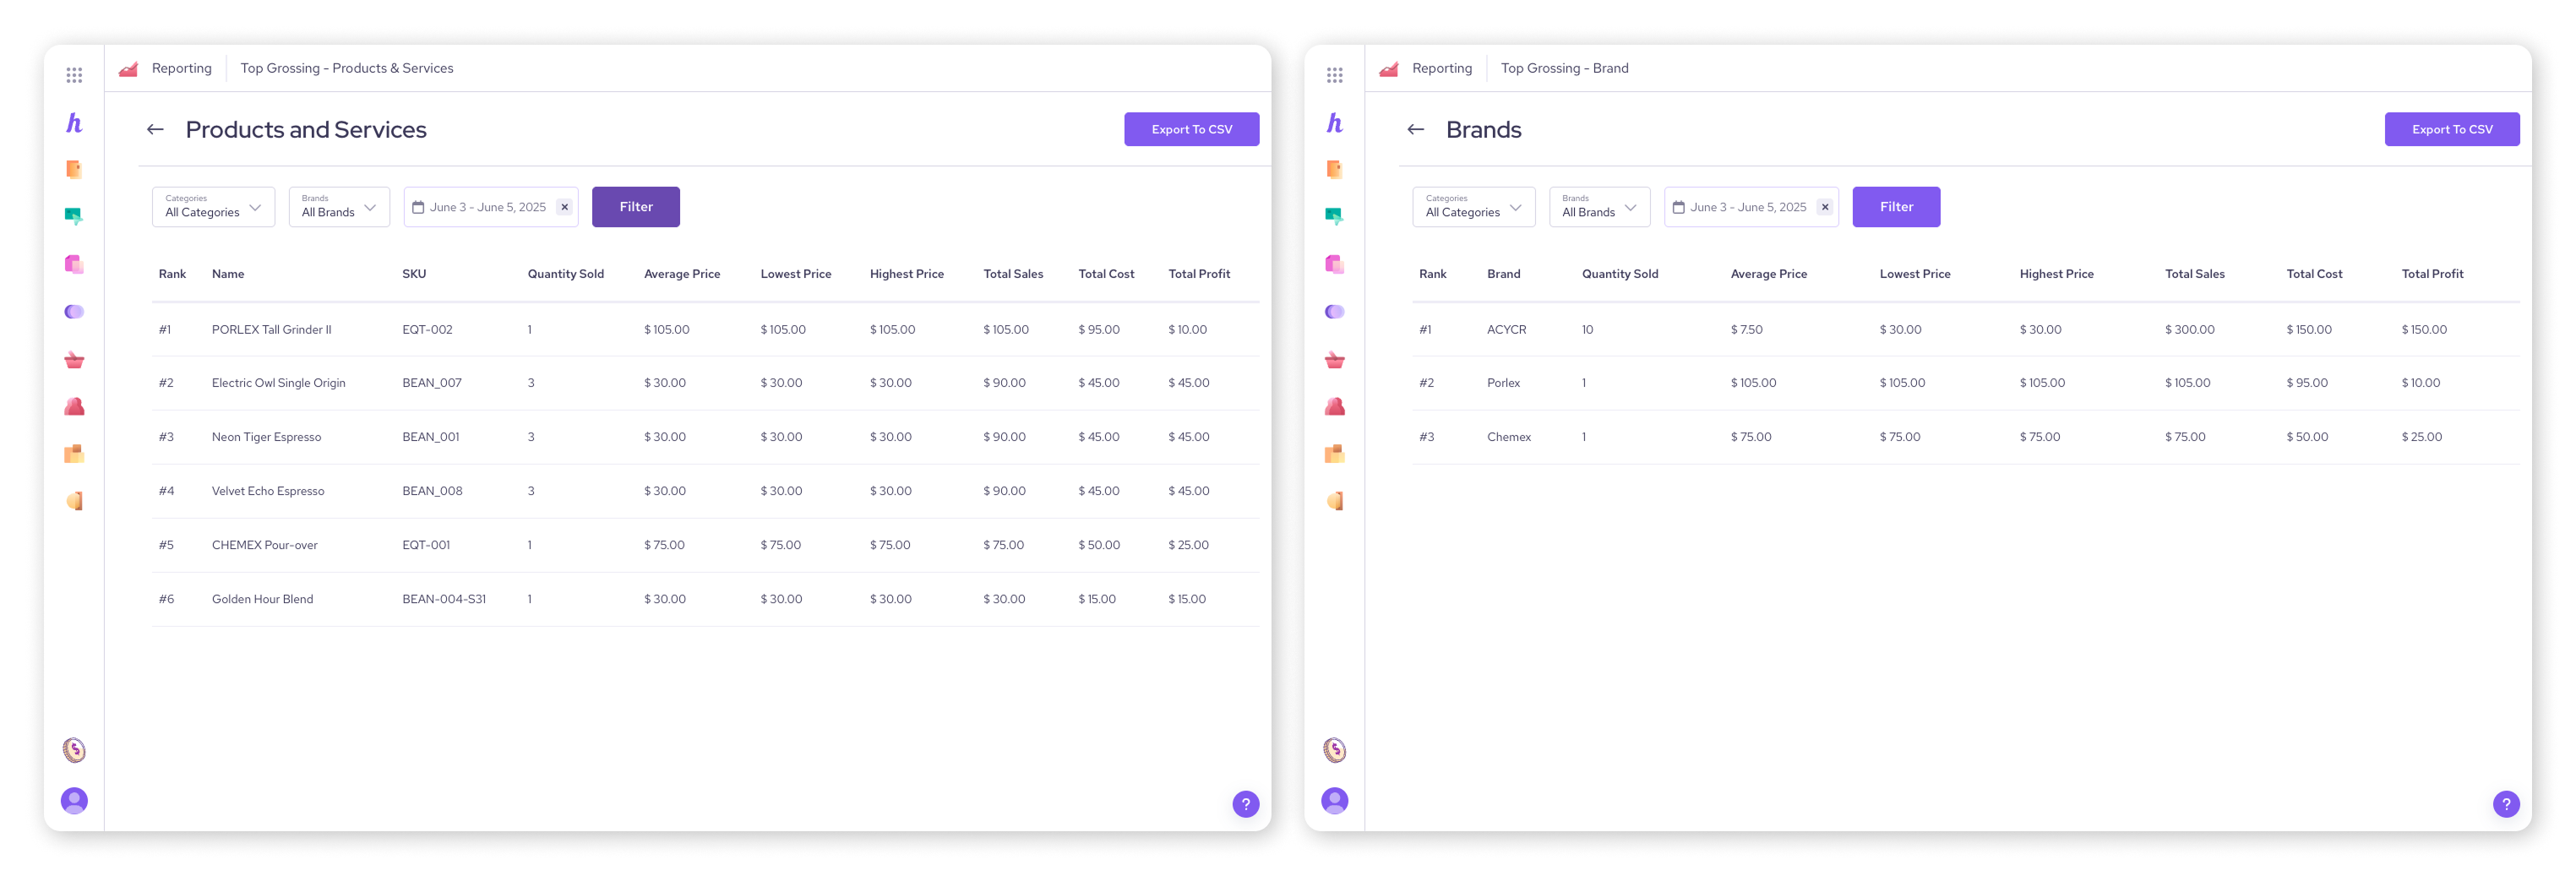
The 'Top Grossing' reports help you identify which products, brands, or categories are bringing in the most revenue for your business. This focuses on the total amount earned rather than just quantity sold.
Available reports:
'Top Grossing - Products & Services': Shows items with the highest total sales.
'Top Grossing - Brand': Identifies brands contributing the most gross income.
'Top Grossing - Category': Highlights categories generating the most revenue.
Common columns across these reports include:
Rank: The product's position in the gross income ranking.
Name (or Brand/Category): The name of the product, brand, or category (dependent on the report).
SKU (for products & services): The stock keeping unit for the product.
Quantity sold: The total number of units sold.
Average price: The average price at which the item was sold.
Lowest price: The lowest price at which the item was sold during the period.
Highest price: The highest price at which the item was sold during the period.
Total sales: The total revenue generated from the item.
Total cost: The total cost of the items sold.
Total profit: The total profit earned from the item (Total Sales - Total Cost).
Important notes for product and category data
Keep these details in mind when using your product-related reports:
Data on Products or Categories are tied to the product SKU. If the SKU is changed, historical information and sales will no longer display on generated reports.
Order-level discounts (discounts applied to an entire invoice) are not factored into individual product and category sales amounts.
For example, if an invoice has two items totaling $7 ($5 and $2) and an overall discount of $4, the product and category sales will still show $7, not the discounted $3 total.
Product and category sections do not account for partially paid invoices.
For instance, if an invoice contains a product for $5 but was only partially paid for $2.50, the product and category sales will still display $5, while the sales totals and invoice totals will accurately display $2.50.
Next steps
Once you've optimized your product offerings, consider how to manage your invoices and tax obligations efficiently.
| Read our next article on reports: Invoices and tax reports. |
FAQs
Why isn't a product showing up in my product inventory report if it hasn't sold recently?
The product inventory report specifically displays products that were sold within the filtered dates.
Can I search for a specific product in the goods sold report?
Yes, use the Filter Goods box to search by keyword.
How do the "Total Sales" and "Total Profit" values differ in the top selling/grossing reports?
Total Sales represents the total revenue generated, while Total Profit accounts for the cost of goods sold.